REPORT For Date 29/01/2018
NY COT EXCHANGE Cotton No.2 (Price figures in cent/5000lbs):
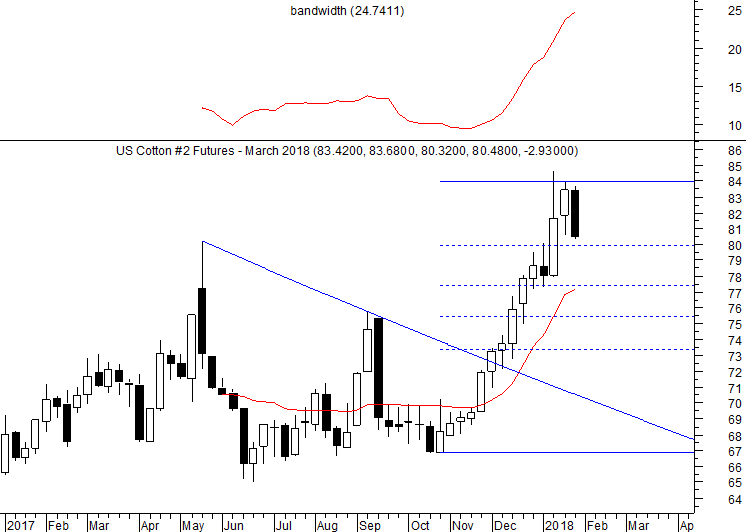
A swing top appears to be in place as a result of the lower high and lower low in relation to its previous week high/low.
The candle has been bearish along with the swing top.
Resistance will be at 82.66-84.7-88.02.
Lower range for the week can be 81.38-78.06.
Exit long on rise from 83.42 to 84.65.
Retracement of the rise from 66.89 to 83.95 is likely.
The 23.6% and 38.2% retracement levels are placed at 80 and 77.30.
Expect correction/consolidation and sideways movement between the peak of 84.65 and 77.30.
Bandwidth is rising but may turn down as a result swing top with bearish candle.
Objective remains to exit long and take profit event as the trend remains up.
Correction in near term with volatility cannot be ruled out.
TREND INFORMATION WITH INTRA-DAY LEVELS
|
STRATEGY
|
CLOSE
|
DRV
|
TREND*
|
Trend
Price
|
Trend
Date
|
L1
|
L2
|
CP
|
L3
|
L4
|
|
-
|
80.48
|
77.19
|
UP
|
71.9
|
23.11
|
75.95
|
79.31
|
81.49
|
82.67
|
86.03
|
*Trend will remain Down as long as last close is below the pink color DRV. Trend will be Up as long as Price is above DRV. Positional Traders: If trend is up then traders long can hold long position with closing stop loss of DRV: Close >DRV. If trend is down then traders can hold short position with a closing stop loss of DRV: Close <DRV.
PRICE, VOLUME AND OPEN INTEREST STRATEGY
|
Close
|
PRICE G/L%
|
VOLUME
|
% V INC/DEC
|
OPEN INTEREST
|
% OI INC/DEC
|
CANDLE
|
POSITION
|
|
80.5
|
-3.5
|
92129
|
-4.4
|
-
|
-
|
Negative
|
-
|
TECHNICAL INDICATORS TABLE
|
RSI
|
1-ROC-RSI
|
Stochastic
|
1-ROC-
Stochastic
|
MACD
|
1-ROC
MACD
|
RS
|
1-ROC
RS
|
|
65.79
|
-12.91
|
71.19
|
-9.72
|
2.93
|
3.38
|
55.31
|
-32.46
|
Note: UP Green= Shows Up Trend as Close > DRV (Pink Line), DN Red= Shows Down Trend as Close < DRV(Pink Line), Red Color Bar= Down Trend + Bandwidth Is Rising, Green Color Bars= Up Trend + Bandwidth Is Rising, Blue Color Bars= Sideways(Trend could be up or down + Bandwidth is falling), Pink Color line= DRV, V marked= Increase in Volume in relation to last few days. Trend will remain Down as long as last close is below the pink color DRV. Trend will be Up as long as Price is above DRV. Bandwidth Indicator= Helps to determine directional speed in the direction of the trend. Falling Bandwidth would indicates loss of momentum being witnessed or likely to be witnessed. Sideways movement may emerge or upside or downside could be locked until Bandwidth does not turn up. Rising Bandwidth can bring about directional momentum.
Disclaimer: There is risk of loss in trading in derivatives and the report is not to be construed as investment advice. The information provided in this report is intended solely for informative purposes. The author, directors and other employees of CC Commodity Info Services cannot be held responsible for the accuracy of the information presented herein or for the results of the positions taken based on the opinions expressed above.